| | |
| |
TTI Assessments & Related Tools
Organizational Surveys – OD Surveys
Identifying Organizational Development Priorities
 These Organizational surveys offer a fast and efficient service that quickly develops customized Internet-based organizational surveys.
After the surveys are completed, you can choose from a variety of OD Survey reports to turn the results into valuable
data for critical decision making.
These OD surveys can be ready to deploy within an amazingly short time frame.
Every organization must seriously assess its operations, policies and practices regularly to
assure they are providing the leadership, work environment, management practices, and incentives to attract top-notch employees.
Frequent organizational surveys, customized to gather the right information, help keep organizations and policies on target for attracting, developing and retaining the best employees.
Survey Customization Services
Since each organizational and 360 survey can be customized to suit your needs, you are in control of the parameters.
 Choose:
– survey titles
– content
– demographics
– categories
– questions
– rating scales
– respondent instructions
– free-form comment areas
– private login / password information
Survey results will appear in the report(s) of your choice. Report types include:
– demographic analysis
– mean score analysis
– favorable / unfavorable analysis
 – frequency distribution written comments
report
– OR – master report of all of the above
OD Survey sample reports:
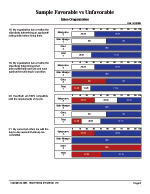
Organizational Favorable - Unfavorable report sample
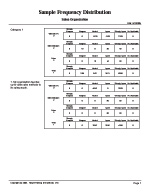
Organizational Frequency Distribution report sample
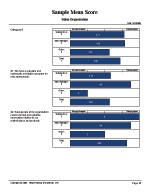
Organizational Mean Score report sample
Organizational Written Comments report sample
Reports Overview
Mean Report
This report type represents the average of responses to a survey question or group of questions
(category). The mean is calculated by adding all the responses to a given question and
dividing the sum by the total amount of responses. The result is indicated by a number and
graphically displayed as a bar graph.
 If an answer option has been identified as a “No Response” (such as “Don’t Know,” or “Not
Applicable”), those responses will be automatically excluded from the calculation of the Mean
score. This ensures that the average is based on the “meaningful” responses.
It is recommended that you use the Mean Report when you need an overall summary of survey
results. The Mean report will provide an at-a-glance look at the data which is very valuable when
you are looking at large amounts of data or when you simply need the average scores.
Favorable/ Unfavorable Report
This report type shows the percentage of respondents who gave favorable, neutral
and unfavorable scores.
Negative responses are typically associated with options like: Strongly Disagree, or Disagree.
Neutral responses are typically associated with options like: Neither Agree nor Disagree, or
Neutral. Positive responses are typically associated with options like: Strongly Agree, or Agree.
 The Favorable/Unfavorable report type automatically groups answer options together to convey
the overall positive, neutral and negative tone of responses. This report is very informative and
more detailed and descriptive than the Mean report.
Just like with the Mean Report, if an answer option has been identified as a “No
Response” (such as “Don’t Know,” or “Not Applicable”), those responses will be automatically
excluded from the calculation of the Favorable, Neutral and Unfavorable percentages. This
ensures that the percentages are based on the “meaningful” responses.
Frequency Distribution Report
This report type shows the percentage of responses under each answer option on a survey
question or group of questions (category). The numbers represent the percent of respondents
that gave a certain response of the total respondents. For example, if 3 out of 10 people marked
“Don’t Know” as a response to a given question, the Frequency Distribution will show 30 %
saying “Don’t Know.” The result are indicated by a number below each answer option.
 Unlike the Mean Report and the Fav./Unfav. Report, in this report the “No Response” (such as “Don’t Know,” or “Not Applicable”) are included and displayed.
This ensures that each answer option, including “No Responses” are tabulated.
It is recommended that you use the Frequency Distribution Report when you need a detailed
description of survey results. The Frequency Distribution report provides an in-depth look at the
data. This report is very valuable when you are looking at small amounts of data and need to
know exactly how many people said what.
Written Comments Report
This type of report provides a comprehensive description of all the written comments provided
by survey respondents. The comments are listed in sequence and separated by a thin horizontal
line. When a survey participant provides no written comments to an open-ended question, the
report shows nothing in between the separating lines.
The written Comments Report is extremely useful to understand qualitative feedback. It is
recommended that as a survey analyst you read all the comments provided before making
interpretations on the numerical data.
Demographic Report
This report type shows the amount percentage of responses for each demographic question. The
pie chart shows how the total amount of respondents who identify themselves in a demographic
question responded to the different demographic choices. For example, suppose that at the end of
a survey respondents were asked to identify their Gender (Male or Female). Suppose that 4
marked “Male” and 6 marked “Female.” The Demographic report will show 40 % “Male,” 60%
“Female” resulting in a total of 100% or 10 actual respondents for that demographic question.
The results are represented on a pie chart.
Respondents who choose not to answer the demographic question are ignored in the calculation.
It is recommended that you use the Demographic Report when you need a description of
respondents’ demographics. The Demographic Report provides a quick look at the profile of
respondents.
OD Survey sample reports:
Organizational Favorable - Unfavorable report sample
Organizational Frequency Distribution report sample
Organizational Mean Score report sample
Organizational Written Comments report sample
Bottom Line
– Employees can easily complete corporate
surveys anywhere, anytime, via secure
Internet access.
– It has never been easier or faster to obtain crucial decision
making information.
– Survey reports are available in a fraction of the time it would
take to develop them yourself.
– Customized surveys and reports can keep your organization
on the road to success.
RELATED SURVEYS:
Teams Evolving and Mastering Success – T.E.A.M.S.™ survey information
360 Feedback survey information
ONLINE ASSESSMENTS
View information about all of the Online Assessments / Reports
Please contact us for more information and pricing.
Return to TTI assessments & training tools main page.
| |
|
 |
Saturday, February 21, 2026


|
|
|
|
|
|
|


